
Infographics

Infographic: How COVID-19 invades the body, step by step
The newest coronavirus, SARS-CoV-2, has created a far deadlier pandemic in part because once it infects a person it can ...
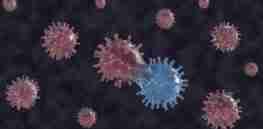
Infographic: How COVID-19 mutated to infect the world
A change in the virus was appearing again and again. This mutation, associated with outbreaks in Europe and New York, ...

Infographic: GMO tomatoes? There’s no such thing. Here are the only biotech crops grown in the US
Are you paying more for “non-GMO pasta?” Then you’re not using your noodle. What are the facts? There are only ...

Infographic: Five GMOs account for 99 percent of the global biotech crop area
In 2018, a total of 70 countries adopted biotech crops — 26 countries planted and 44 additional countries imported. Of ...

Infographic: Racing to create affordable at-home test for COVID-19
To stretch beyond the lab, test developers are racing to produce next-stage technologies that could allow for rapid widespread testing ...
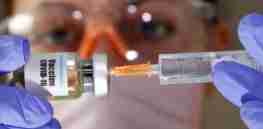
Infographic: 8 ways we can defeat the coronavirus
More than 90 vaccines are being developed against SARS-CoV-2 by research teams in companies and universities across the world. Researchers ...
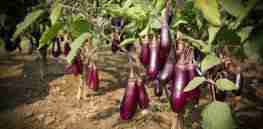
Infographic: Philippines could boost crop yields 192%, cut pesticide use 48% with GMO insect-resistant eggplant
In the Philippines, eggplant farming is a major source of income for thousands of farmers in the eggplant-producing regions in ...

Infographic: From head to toe, coronavirus affects the body in unpredictable ways
Today, there is widespread recognition the novel coronavirus is far more unpredictable than a simple respiratory virus. Often it attacks ...
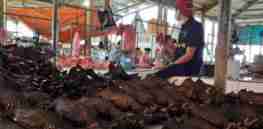
Infographic: 3 factors affecting how viruses jump from animals to humans
Raina Plowright of Montana State University is working with infectious disease experts, ecologists, and a range of other scientists to ...

Where are GMO crops grown? GLP infographics document the global growth of agricultural biotechnology innovation
One of the more popular claims by critics of GMOs is that only a few countries grow genetically engineered crops, ...

Infographic: From vaccines to drugs, chasing ‘silver bullets’ targeting the fast-moving coronavirus
For drug companies, there is suddenly only one priority: the coronavirus. More than 140 experimental drug treatments and vaccines for ...

Infographic: 3 strategies for finding coronavirus treatments
The scientific community is working around the clock, not only to protect us from COVID-19, but to prevent future strains ...

Infographic: Buying time: What we gain from strong coronavirus measures, including suppression strategies
Summary of the article: Strong coronavirus measures today should only last a few weeks, there shouldn’t be a big peak ...

Infographic: Fighting the coronavirus pandemic with collaborative science and data sharing
On February 27, a teenager in the Seattle area was diagnosed with Covid-19. Shortly after, researchers at the Seattle Flu Study shared genomic data ...

Infographic: Where does the coronavirus fit in humanity’s long history of plagues and influenza pandemics?
Disease and illnesses have plagued humanity since the earliest days, our mortal flaw. However, it was not until the marked ...

Infographic: US among world laggards in COVID-19 testing per capita, ranking 22
The available data shows that South Korea has done many more tests than other countries. This suggests that the number ...

Infographic: How the coronavirus appears ‘seemingly out of nowhere’
When Emma Hodcroft read that, seemingly out of nowhere, a rash of cases of the novel coronavirus had popped up in Britain ...

Anxious dog? Here are some things that may be stressing your furry friend
Nearly three out of four dogs exhibit some kind of serious behavioral problem related to anxiety, according to a survey involving nearly ...

Infographic: Tracking the global spread of the coronavirus through its genetic signature
Several years ago, Richard Neher, an evolutionary biologist at the University of Basel in Switzerland, and his colleagues wanted to ...

Infographic: Without improved crop yields, farmers would need a lot more land to feed us
If we took away significant gains in cereal crops yields since 1962, farmers would have been forced to claim more ...

Infographic: How exercise gives your brain a boost
Why does exercise affect the brain at all? Physical activity improves the function of many organ systems in the body, ...

Infographic: These blood biomarkers could be critical to diagnosing, treating Alzheimer’s
Researchers are investigating a host of molecules found in the blood that could reveal pathological processes in the brain. Here ...

Infographic: Exploring ways humans have adapted for endurance running
The Endurance Running hypothesis is the latest incarnation of the open-plain models of human evolution, which speculated that human is ...

Infographic: 13 ways artificial intelligence will help us live to 100
We've long been searching for ways to extend the human lifespan, which currently sits around 79 years. Of course, there ...

Infographic: USDA bioengineered food label makes grocery store debut on GMO Impossible Burger
Impossible Foods has enthusiastically defended its use of genetic engineering to produce meat substitutes ...

Infographic: Eliminating synthetic fertilizer won’t solve agriculture’s nitrogen pollution problem
The proposed solution is worse than the problem it hopes to solve ...

Infographic: How an asteroid killed the dinosaurs
The Cenozoic is the name geologists give to the era spanning the last 66 million years, and it started with the mass ...

Infographic: USDA data reveal dramatic growth of GMO crop adoption in US since 1996
Herbicide-tolerant (HT) crops, which tolerate potent herbicides (such as glyphosate, glufosinate, and dicamba), provide farmers with a broad variety of ...